LoudML Grafana Application
https://github.com/vsergeyev/loudml-grafana-app
Datasource and Graph panel visualization to connect with Loud ML Machine Learning server.

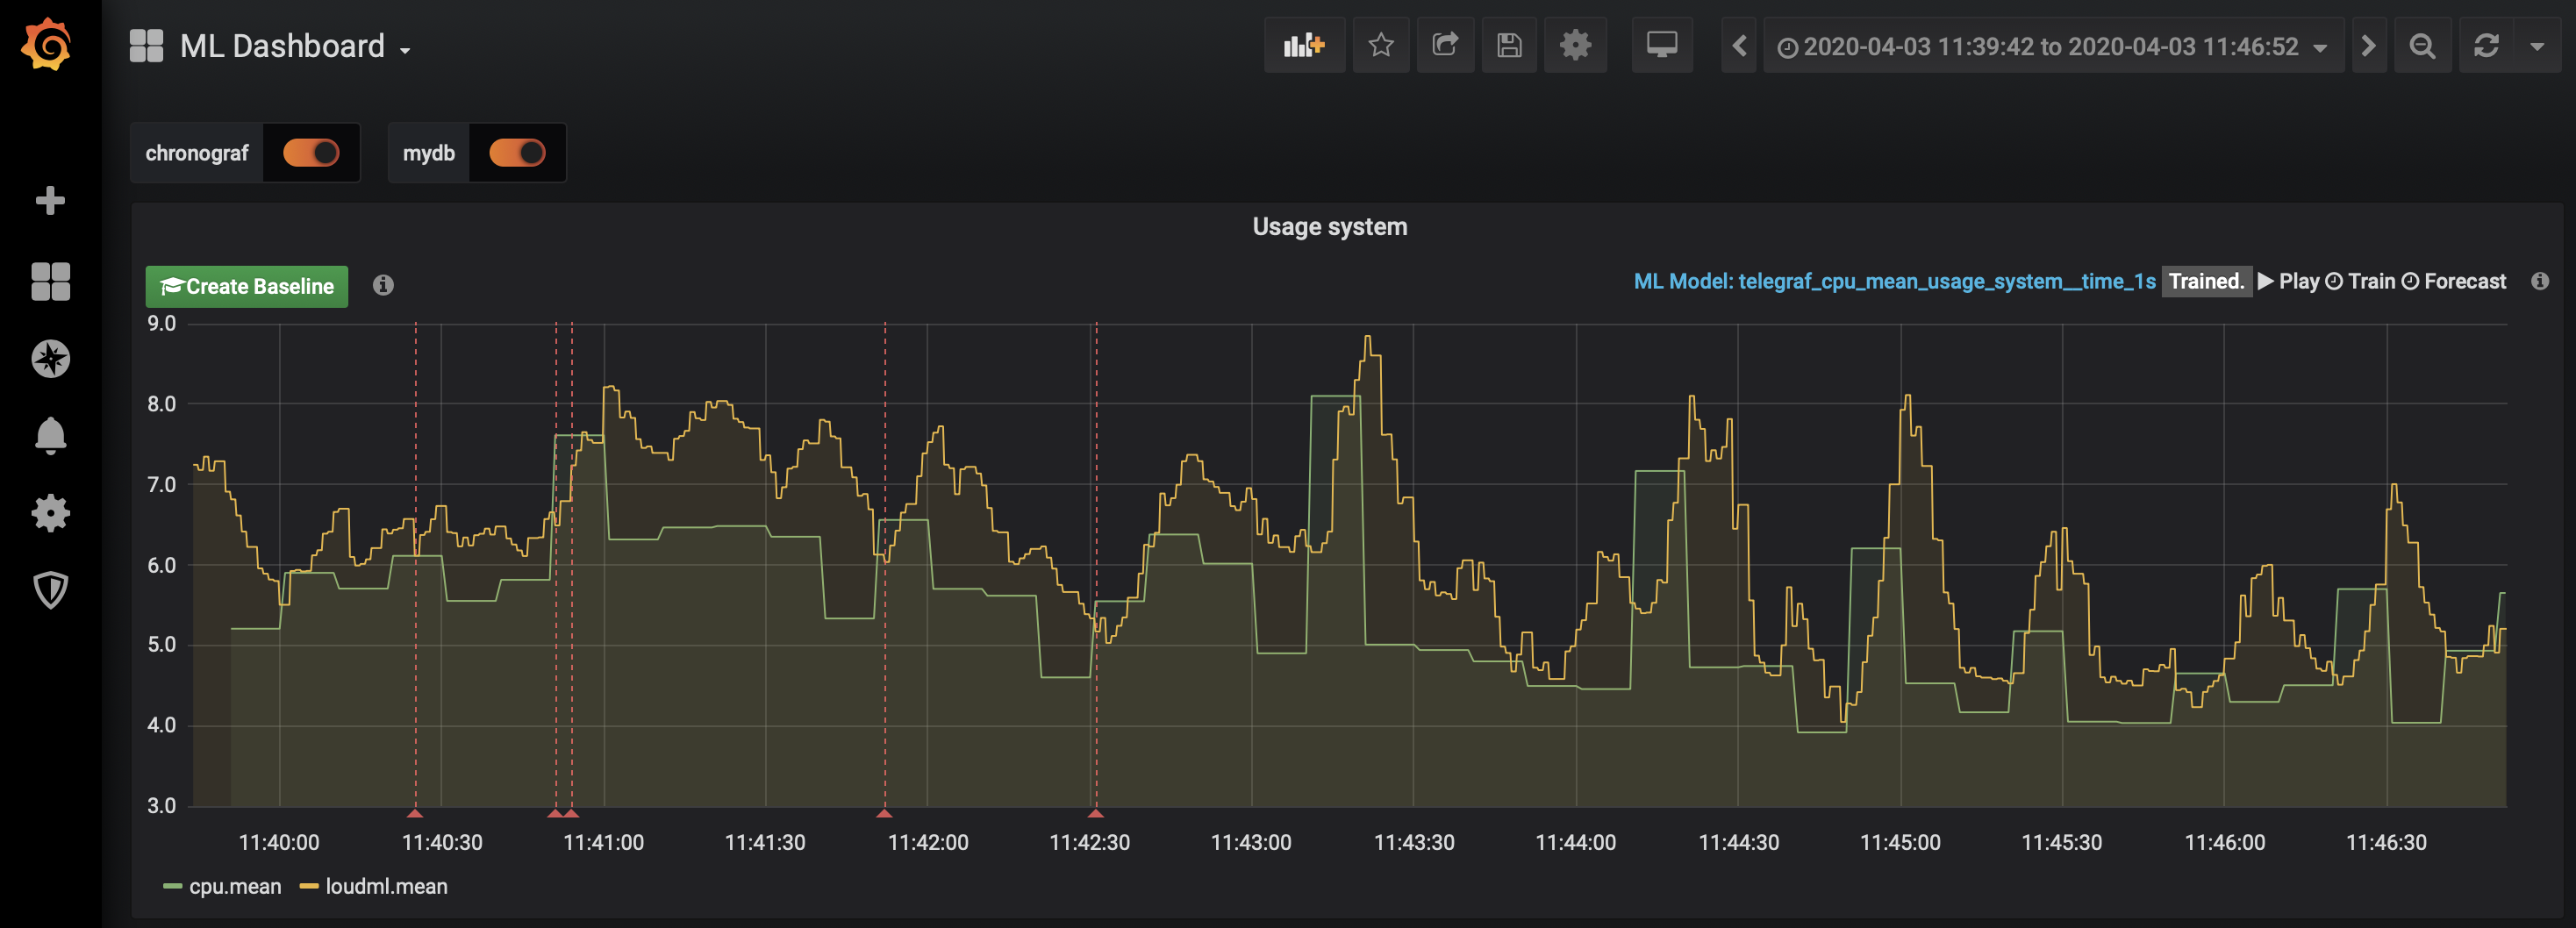
Create a ML models in 1-click with “Create Baseline” button on graph.
- select a time frame
- click “Create Baseline”
- train model
- run a prediction
- observe anomalies (as annotations on graph)
Currently 1-click ML button (“Create Baseline”) can produce model from:
- InfluxDB datasource
- OpenTSDB datasource
- Elasticsearch datasource (beta)
- Prometheus datasource (very draft)
Watch this video on YouTube:
Loud ML use a Tensor Flow and Keras as a backend. It works with VAE models, combines the best of unsupervised and supervised learning. Based on a work “Unsupervised Anomaly Detection via Variational Auto-Encoderfor Seasonal KPIs in Web Applications” algorythm is best suitable to closely monitor various KPIs (DB connections, page views, number of online users, number of orders, etc).
Per ML algorythm documentation:
Donut is an unsupervisedanomaly detection algorithm based on VAE. It greatly outperforms a state-of-arts super-vised ensemble approach and a baseline VAE approach, and its best F-scores range from 0.75 to 0.9 for the studied KPIs from a top global Internet company. ... Unlike discriminative models which are designed for just one pur-pose (e.g., a classifier is designed for just computing the classifi-cation probabilityp(y|x)), generative models like VAE can derivevarious outputs.
Installation
Default assumption - you use Grafana 6.x. For Grafana 7.x please use appropriate ZIP file.
A) Give it a try with Docker
  docker run -d \
  -p 3000:3000 \
  --name=grafana \
  -e "GF_INSTALL_PLUGINS=https://github.com/vsergeyev/loudml-grafana-app/raw/master/loudml-grafana-app-latest.zip;loudml-grafana-app" \
  grafana/grafana
Setup LoudML if needed (please refer to https://hub.docker.com/r/loudml/loudml for config.yml setup)
  docker run -p 8077:8077 \
  -v $PWD/lib/loudml:/var/lib/loudml:rw \
  -v $PWD/config.yml:/etc/loudml/config.yml:ro \
  -ti \
  loudml/loudml
B) In existing Grafana container
- Connect to your Grafana server if necessary (e.g. via SSH).
-
Go to plugins directory (usually data/plugins under Grafana installation or /var/lib/grafana/plugins)
cd /var/lib/grafana/plugins -
Download loudml-grafana-app-latest.zip zip file:
wget https://github.com/vsergeyev/loudml-grafana-app/raw/master/loudml-grafana-app-latest.zip -
Unpack it there
unzip loudml-grafana-app-latest.zip - You may remove the downloaded archive
- Restart Grafana
C) From sources (note - github latest is for Grafana 7.x)
- Plugin should be placed in
.../grafana/data/plugins - git clone https://github.com/vsergeyev/loudml-grafana-app.git
- cd loudml-grafana-app
- yarn
- yarn dev –watch
- restart Grafana
- LoudML app should be in plugins list, you may need to activate it
- enjoy :)
Prerequisites
* Loud ML server https://github.com/regel/loudml
* Grafana >= 5.4.0
Configuration
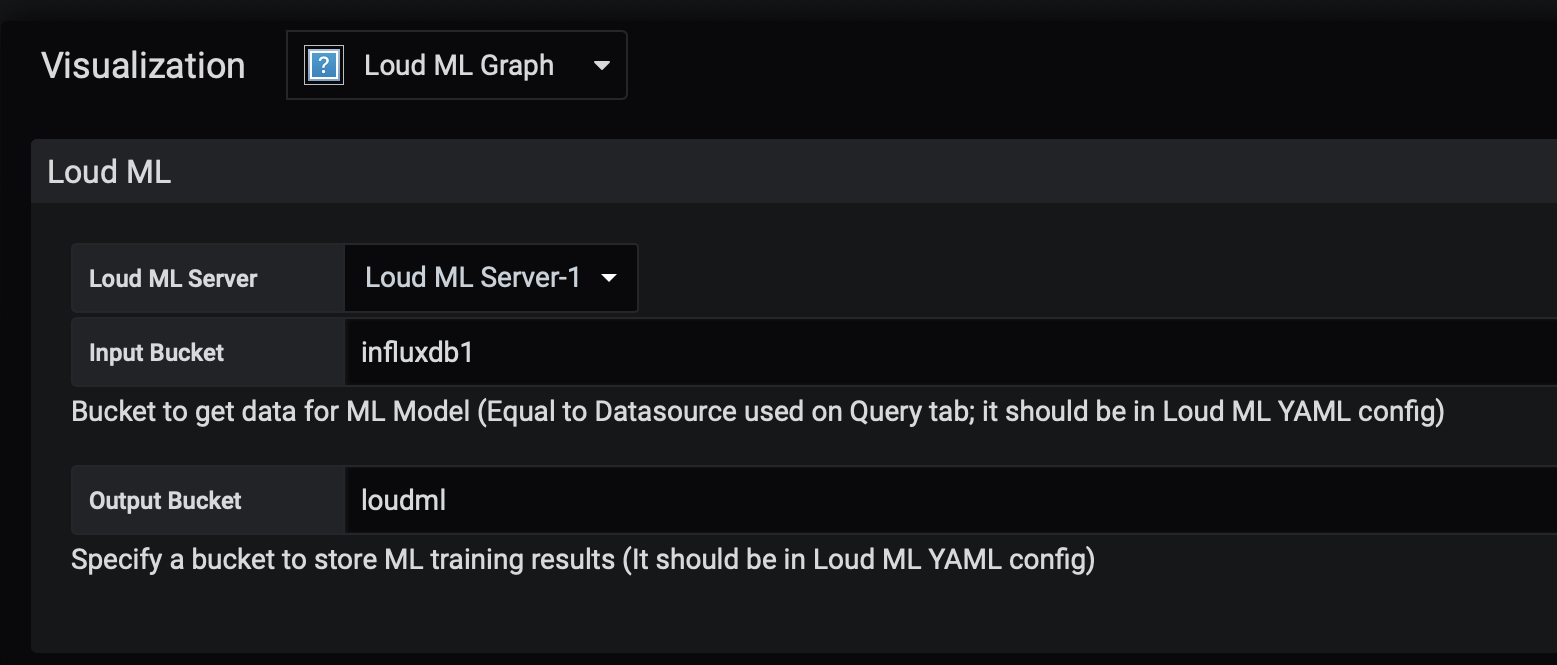
In order to use Loud ML with Grafana you need to have a buckets in loudml.yml to reflect Grafana datasource(s) used in LoudML Graph

Example: I have InfluxDB datasource with telegraf database as an input and will use loudml database as output for ML model predictions/forecasting/anomalies:
buckets:
 - name: loudml
   type: influxdb
   addr: 127.0.0.1:8086
   database: loudml
   retention_policy: autogen
   measurement: loudml
   annotation_db: loudmlannotations
 - name: influxdb1
   type: influxdb
   addr: 127.0.0.1:8086
   database: telegraf
   retention_policy: autogen
   measurement: loudml
 - name: data
   type: influxdb
   addr: 127.0.0.1:8086
   database: data
   retention_policy: autogen
   measurement: sinus
 - name: opentsdb1
   type: opentsdb
   addr: 127.0.0.1:4242
   retention_policy: autogen
 - name: prom1
   type: prometheus
   addr: 127.0.0.1:9090
   retention_policy: autogen
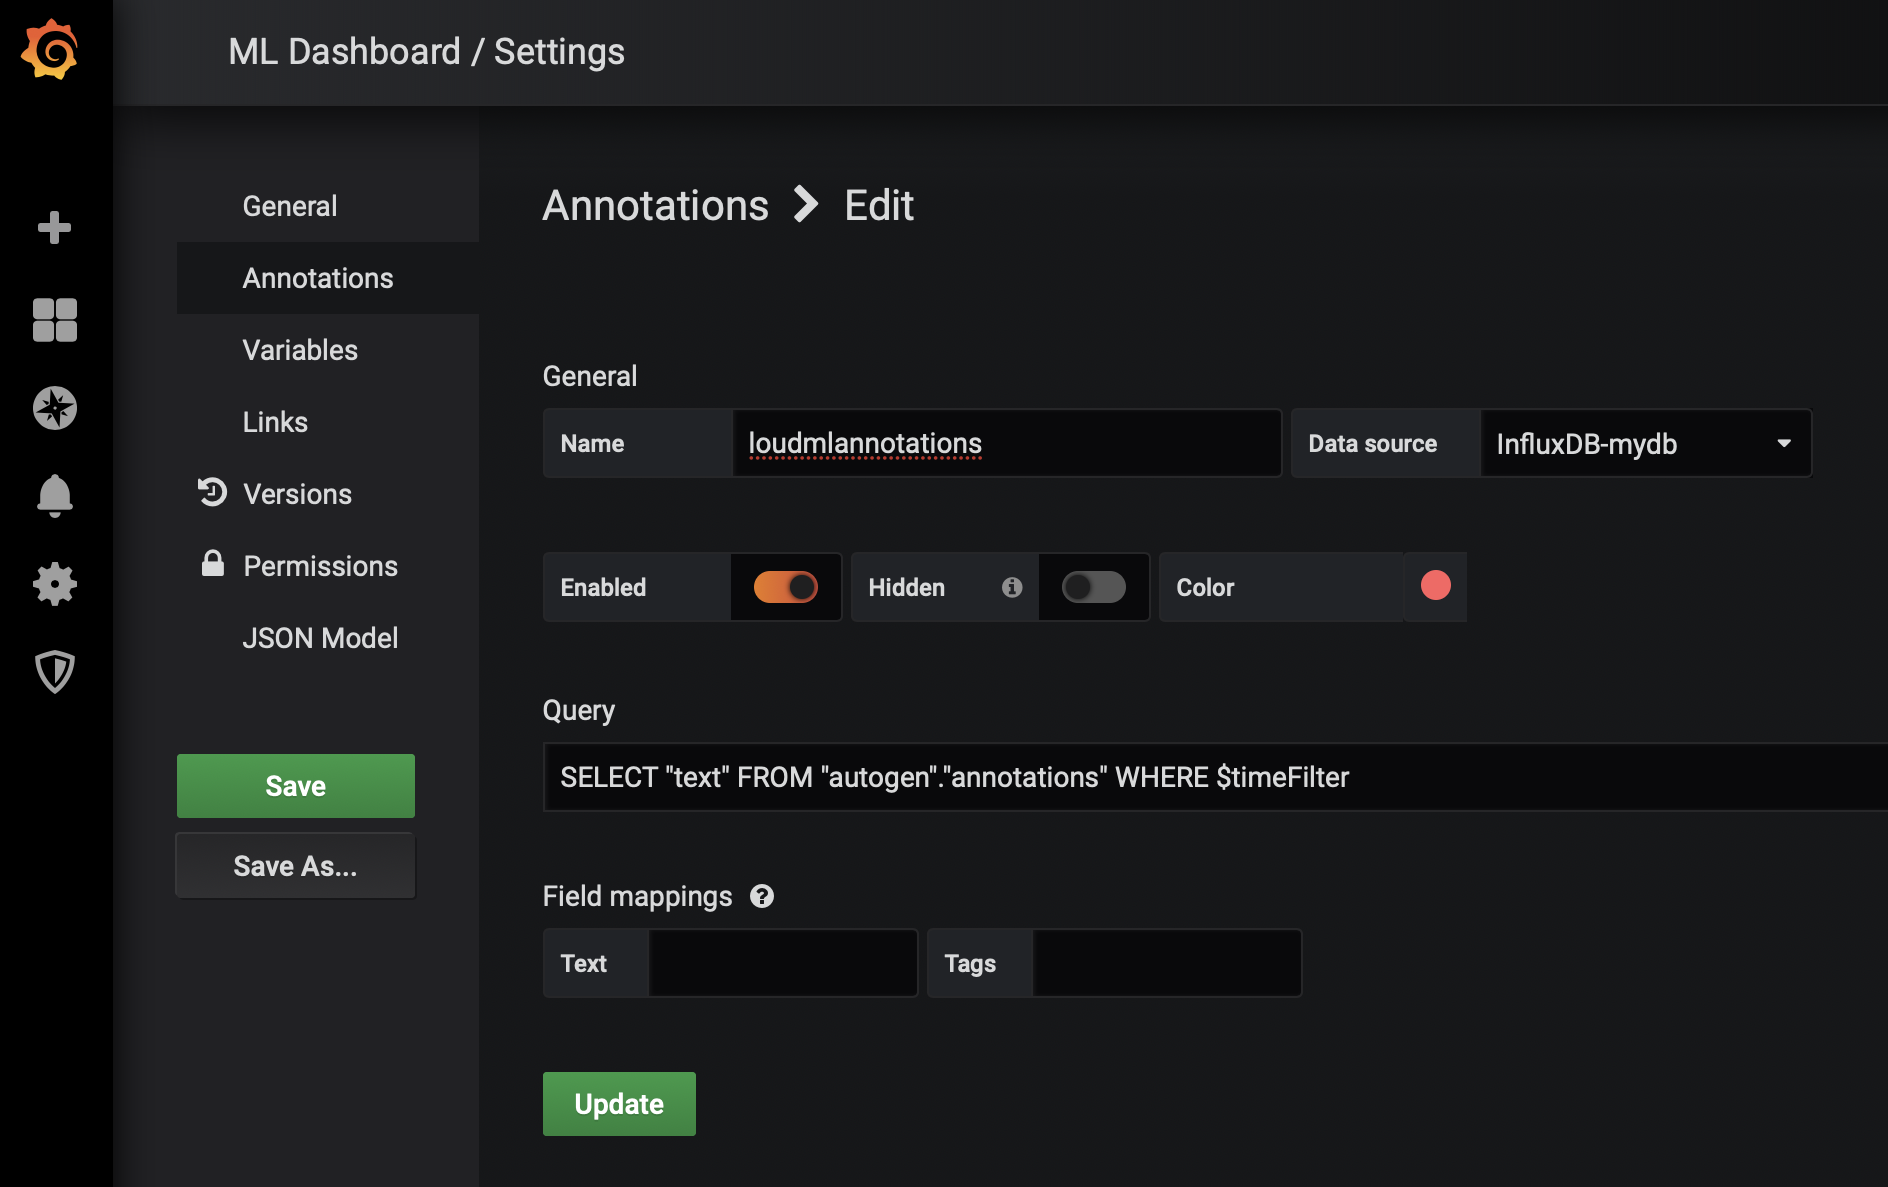
InfluxDB loudmlannotations here specified to store annotations. (By default Loud ML server will store annotations in chronograf database). So on Grafana dashboard annotations/anomalies from Loud ML should be configured as:
SELECT "text" FROM "autogen"."annotations" WHERE $timeFilter

Links
- Creating a model for system usage metric
- Loud ML
- Unsupervised Anomaly Detection via Variational Auto-Encoderfor Seasonal KPIs in Web Applications
- Forecasting time series with 1-click machine learning
- Applying Machine Learning Models to InfluxDB
Changelog
- 1.6.0 Better Grafana 6.x compatibility. Fixed issue with output bucket.
- 1.5.0 Added capability to add and edit models on Loud ML Datasource page.
- 1.4.0 Changed ID to correct format “loudml-grafana-app”; Fixes code style follow guidelines.
- 1.3.0 Fixed issue #5 with fill(0); New capabilities: multiple metrics/features per ML model (for InfluxDB data).
- 1.2.0 New capabilities: LoudML datasource - add scheduled job; list of scheduled jobs.
- 1.1.0 Initial public release
